Datadog + Sentry Integration
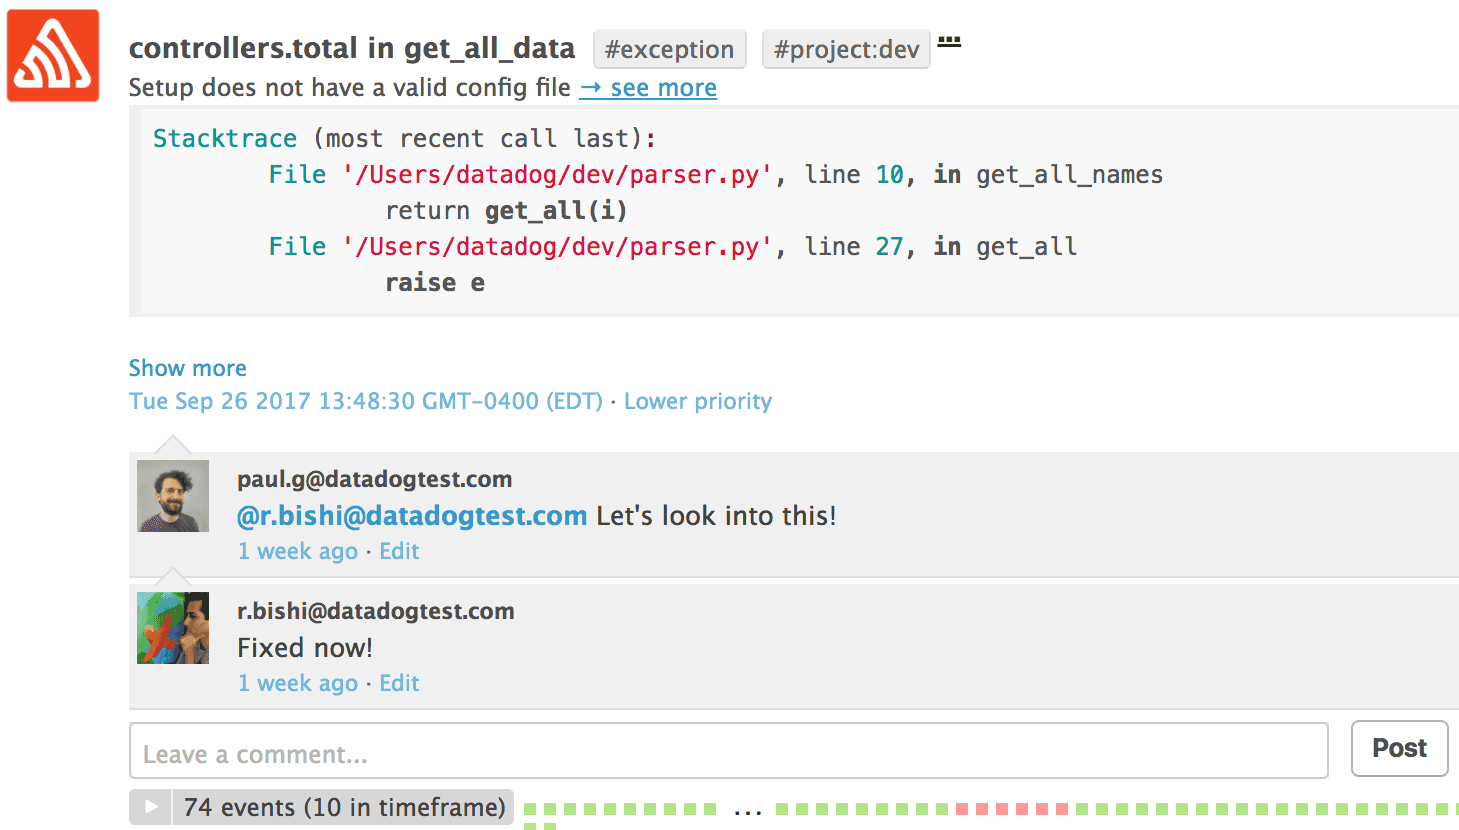
Correlate errors from Sentry with metrics in your Datadog dashboards.
See the docs
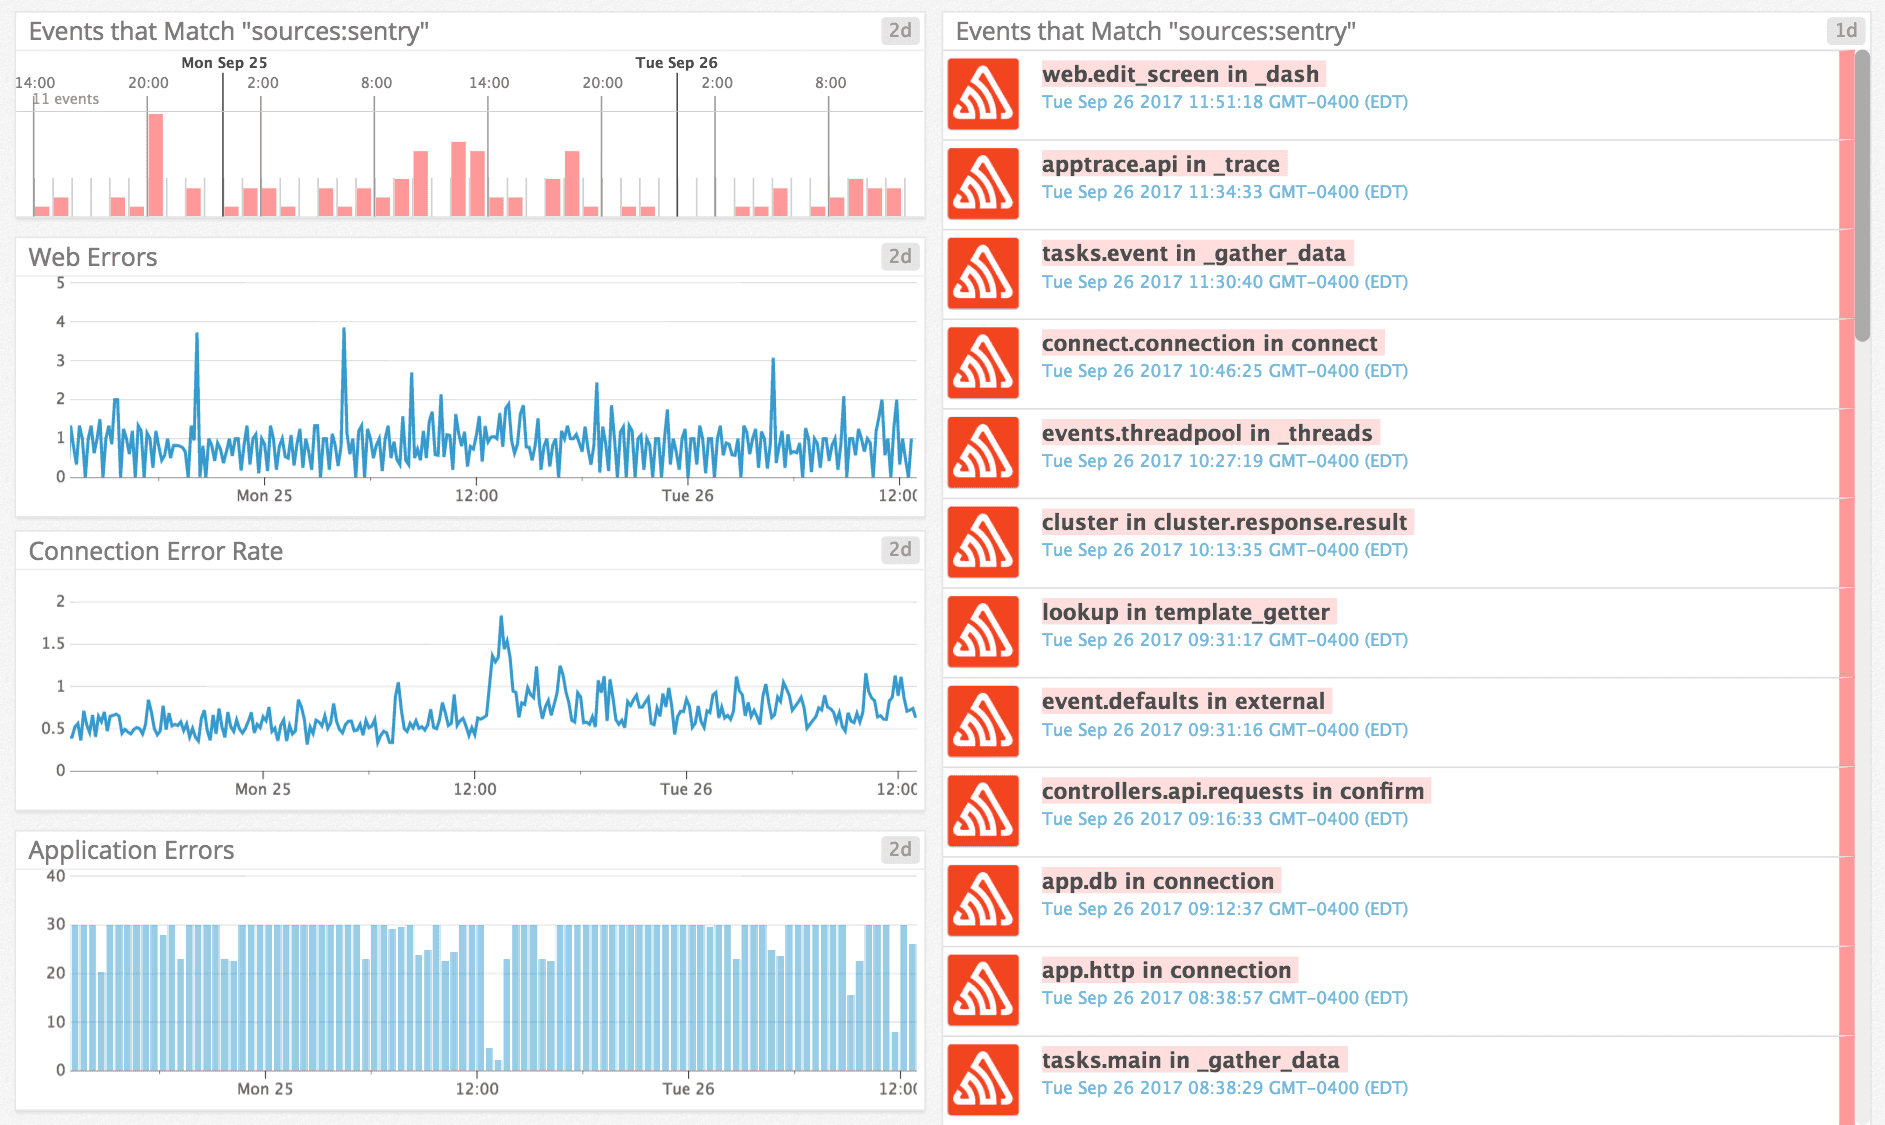
Events and metrics in one dashboard
Quickly discover relationships between production apps and systems performance. Seeing correlations between Sentry events and metrics from infra services like AWS, Elasticsearch, Docker, and Kafka can save time detecting sources of future spikes.

Synthetic error dashboards
Build custom visualizations showing off any events you choose from Sentry using the query sources:sentry to create a new Datadog dashboard and plot error trends over time.
Read the config guide to get started.
Is your data secure?
You better believe it.
Just look at all the high-quality security
features all accounts get, regardless of plan.
- Two-Factor Auth
- Single Sign-On support
- Organization audit log
- SOC 2 Type II and ISO 27001 certified
- HIPAA attestation
- PII data scrubbing
- SSL encryption
- Data Processing Addendum (includes latest EU SCCs)
- Privacy Shield certified
A better experience for your users. An easier life for your developers.
A peek at your privacy
Here’s a quick look at how Sentry handles your personal information (PII).
×Who we collect PII from
We collect PII about people browsing our website, users of the Sentry service, prospective customers, and people who otherwise interact with us.
What if my PII is included in data sent to Sentry by a Sentry customer (e.g., someone using Sentry to monitor their app)? In this case you have to contact the Sentry customer (e.g., the maker of the app). We do not control the data that is sent to us through the Sentry service for the purposes of application monitoring.
Am I included?PII we may collect about you
- PII provided by you and related to your
- Account, profile, and login
- Requests and inquiries
- Purchases
- PII collected from your device and usage
- PII collected from third parties (e.g., social media)
How we use your PII
- To operate our site and service
- To protect and improve our site and service
- To provide customer care and support
- To communicate with you
- For other purposes (that we inform you of at collection)
Third parties who receive your PII
We may disclose your PII to the following type of recipients:
- Subsidiaries and other affiliates
- Service providers
- Partners (go-to-market, analytics)
- Third-party platforms (when you connect them to our service)
- Governmental authorities (where necessary)
- An actual or potential buyer
We use cookies (but not for advertising)
- We do not use advertising or targeting cookies
- We use necessary cookies to run and improve our site and service
- You can disable cookies but this can impact your use or access to certain parts of our site and service
Know your rights
You may have the following rights related to your PII:
- Access, correct, and update
- Object to or restrict processing
- Port over
- Opt-out of marketing
- Be forgotten by Sentry
- Withdraw your consent
- Complain about us
If you have any questions or concerns about your privacy at Sentry, please email us at compliance@sentry.io.
If you are a California resident, see our Supplemental notice.


